
Bull Market in 2024?
Recent on-chain indicators suggest that Bitcoin is not yet overvalued and could continue to rise next year.
Bitcoin’s strong gains this week were met with resistance and a brief pause. After hitting a yearly high of $4450, BTC suffered its third sharpest selloff of 2023. This is likely due to some profit-taking by short-term holders of BTC following strong price gains in recent months.
Glassnode’s newsletter this week analyzed BTC’s price this way.
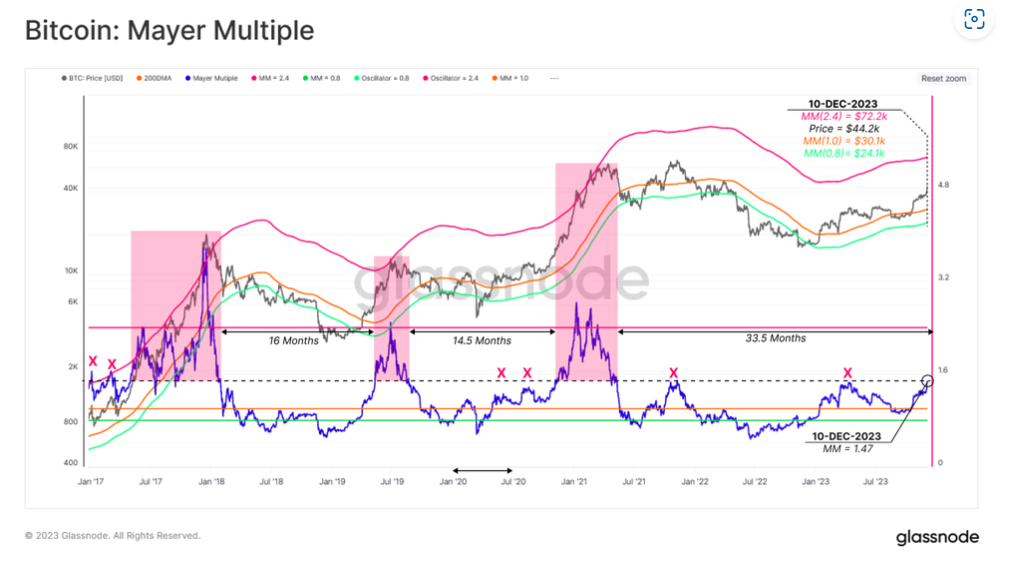
“Several on-chain pricing models suggest that ‘fair value’ based on investor cost basis and network throughput are lagging, hovering between $30k and $36k.”
On the Mayer Multiple indicator, the 28-day 🟢 and 90-day 🔴 variants are worth noting. This is because we are seeing behavior that is typical of the transition from a bear market to a bull market. The fast 28-day moving average is trading higher than the 90-day moving average, which has been the case since October. The recent BTC rally has been the steepest since the market peak in November 2021. However, this could be a short-term “overvaluation” signal for network throughput, and investors should be cautious.
(According to Glassnode, The NVT Price is seeking a fundamental valuation of the network based on its utility as a settlement layer for USD-denominated value.)
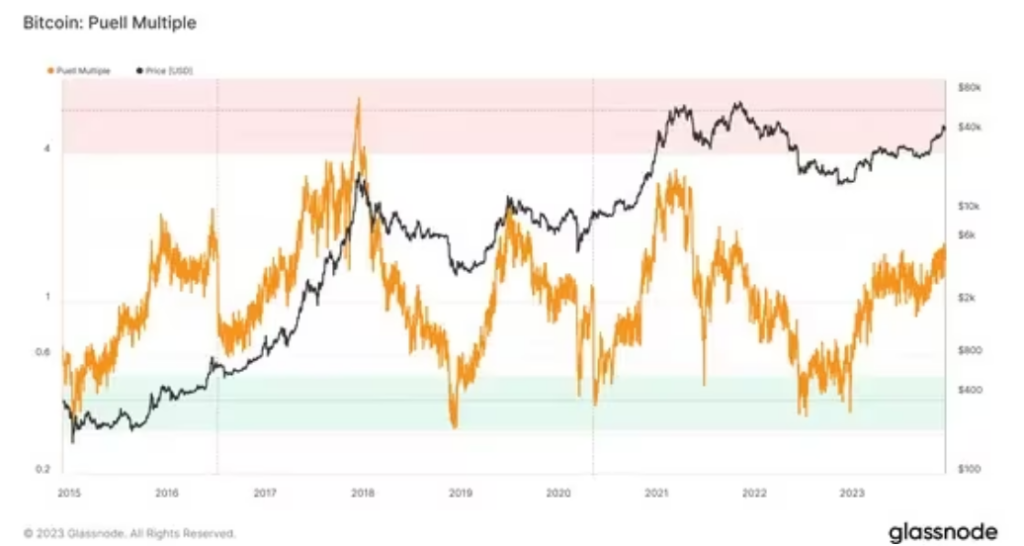
Puell Multiple
The Puell Multiple index shows a similar signal. According to Glassnode, the indicator is currently bottoming out at 1.53. The Puell Multiple index is the value of coins mined per day divided by the average value over the past year, and it quantifies the profitability of mining for miners.
The Puell Multiple could also fall back toward the accumulation zone following Bitcoin’s fourth reward halving in March. Typically, at bull market peaks, the number is above 4, and can even spike to 10, especially early in a bull market.
STH – realize profits
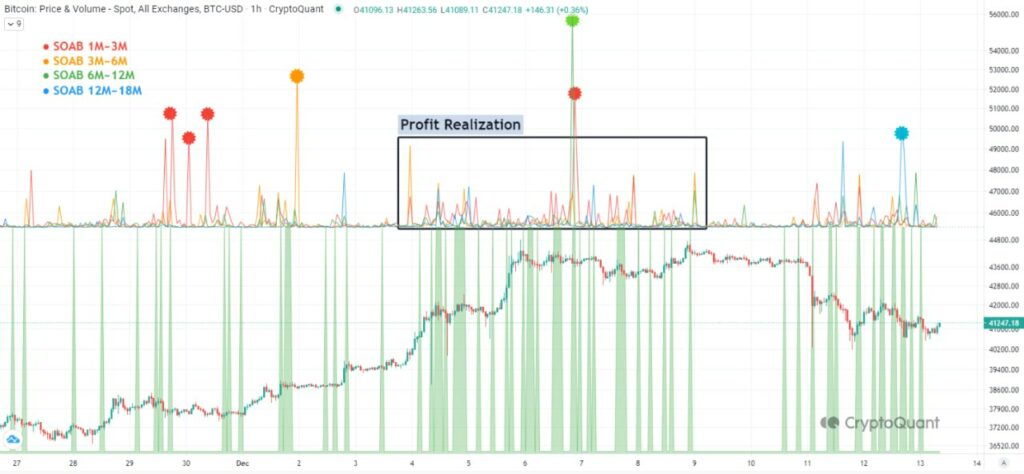
Yonsei_dent, a writer to on-chain data analysis site Cryptoquant, analyzed it this way.
“When the price broke the psychological resistance of $40k, STH and the 6M~18M cohort showed a move to realize profits.”
The binary CDD is an indicator that shows when long-term investors are active, with denser green boxes. A high density can be interpreted as long-term investors moving a lot of coins they have held for a long time to sell.
During the December rally above $40k, binary CDDs were also active, and after reaching a high of $44.7k, the price returned to the $41k level. Given that most of the volume was in the money, we suspect that the price fell as investors sold to realize profits.
View other articles: From Coinbase to Binance: Institutional Investors’ Focus on BTC
(Content created on Web3 Builders is copyrighted by Web3 Builders. Please credit the source when quoting. You are advised to conduct your own research before making any investment decisions. Use provided information at your own risk.)